
Cape Town property values growing strongly – along with informal structure numbers

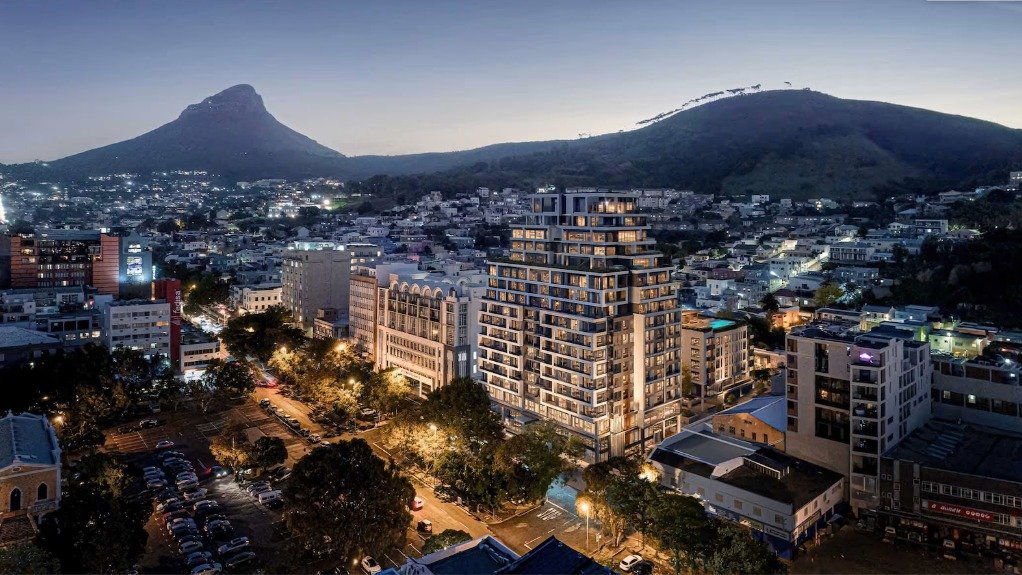


The estimated total value of all properties on the City of Cape Town’s general valuation roll has jumped by 145% from R0.91-trillion rand in 2012 to R2.227-trillion in 2025.
This is according to the Western Cape capital’s fourth and latest Spatial Trends and Implementation Tracking Report.
The report provides an overview of development and land-use patterns in Cape Town since 2012.
Between 2012 and 2025, the strongest growth in property values occurred along Cape Town's coastal and high-amenity areas, particularly the Atlantic Seaboard, City Bowl, Southern Peninsula, Bloubergstrand, Somerset West and Durbanville.
“Changes reflect spatially differentiated demand and supply, redevelopment and new development, including development on previously vacant land,” notes the report.
In contrast, the weakest growth was observed in Philippi and parts of the Cape Flats, including Mitchells Plain, while Khayelitsha recorded moderate to low levels of property value appreciation.
This spatial pattern suggests that accessibility, coastal location, environmental amenities and market demand continue to be key drivers of property value growth across the metropolitan area, notes the report.
The report explains that a number of internal and external hedonic pricing factors also play a role in determining property values.
Internal factors relate to the characteristics of the property itself, including the land and buildings, such as size, appearance and finishes.
External factors relate to the characteristics of the surrounding environment, such as crime rates, proximity to facilities and other locations (with both positive and negative implications), desirable locations (such as the coast and the mountain), and the value of other properties in the area.
Booming Table Bay
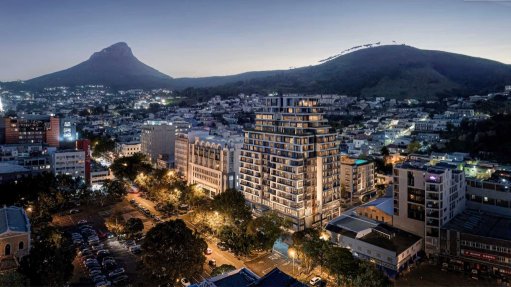
In the high-density Table Bay district, which includes the Atlantic Seaboard and central business district (CBD), the estimated total value of properties on the city’s general valuation roll increased from R196-billion in 2012 to R464.1-billion in 2025.
The Spatial Trends and Implementation Tracking Report states that property values have increased across the district, with the most significant increases in and around the CBD, extending into Woodstock and Salt River.
The pattern of property-value change broadly aligns with areas designated as mixed-use intensification areas, development focus areas and new development areas.
Redevelopment and property improvements in Woodstock and Salt River have contributed to some of the observed increase in property values.
Spatially targeted mechanisms and tax incentives, including National Treasury’s Urban Development Zone (UDZ), have also supported commercial and residential development in the inner city.
Increases in property values in this district cannot, however, be attributed solely to policy or changes in density, notes the report.
The locational qualities of the CBD and Atlantic Seaboard, including access to employment, sea and mountain views, heritage landscapes, and destinations such as the promenade, Table Mountain and the V&A Waterfront, also contribute to higher property values.
“Higher-density development tends to occur in areas where higher property prices can be achieved,” adds the report.
“The district remains attractive for development and has generally experienced increasing property values, excluding properties within national park boundaries.
“Property values are lower or have declined in some locations on the edges of established neighbourhoods or closer to industrial areas.”
67% Jump in Informal Structures
According to the latest Spatial Trends and Implementation Tracking Report, Cape Town’s urban footprint, or built environment, grew by 4 056 ha between 2012 and 2024, with some 31% of land inside the urban development edge still undeveloped.
Formal gross residential density has increased from eight dwellings a hectare in 2012, to 11 dwellings a hectare in 2025, however, the rate and form of densification vary between the city’s eight planning districts.
There has also been a 30% increase in Cape Town’s formally protected and conserved areas between 2009 and 2025, owing to land acquisitions and conservation land banking.
Non-residential development increased substantially between 2012 and 2025 from roughly 41 million square metres to around 60 million square metres of floor area – a 41% increase – with much of this growth in established industrial and business locations.
Warehousing has been the fastest growing non-residential land use sector, while manufacturing remains the largest by total floor area, reflecting continued industrial activity and expanding logistics and distribution functions.
There has also been 27.3% growth in formal housing stock since 2010/11 until 2024/2025.
Informal structures, meanwhile, increased by about 67%, from 169 330 to 283 379 units since 2016.
This growth remains concentrated in the metro south-east and along major transport corridors such as the N2, N1, N7 and key rail corridors.
Article Enquiry
Email Article
Save Article
Feedback
To advertise email advertising@creamermedia.co.za or click here

Projects
Latest Multimedia

Latest News
Showroom
Mitsubishi Chemical Advanced Materials South Africa (Pty) Ltd is a leading manufacturer of high-performance engineering plastics for the mining...
VISIT SHOWROOM
SmartMine IoT has been developed with the mining industry in mind, to provides our customers with powerful business intelligence and data modelling...
VISIT SHOWROOM
Press Office
Announcements
What's On
Subscribe to improve your user experience...
Option 1 (equivalent of R125 a month):
Receive a weekly copy of Creamer Media's Engineering News & Mining Weekly magazine
(print copy for those in South Africa and e-magazine for those outside of South Africa)
Receive daily email newsletters
Access to full search results
Access archive of magazine back copies
Access to Projects in Progress
Access to ONE Research Report of your choice in PDF format
Option 2 (equivalent of R375 a month):
All benefits from Option 1
PLUS
Access to Creamer Media's Research Channel Africa for ALL Research Reports, in PDF format, on various industrial and mining sectors
including Electricity; Water; Energy Transition; Hydrogen; Roads, Rail and Ports; Coal; Gold; Platinum; Battery Metals; etc.
Already a subscriber?
Forgotten your password?
Receive weekly copy of Creamer Media's Engineering News & Mining Weekly magazine (print copy for those in South Africa and e-magazine for those outside of South Africa)
➕
Recieve daily email newsletters
➕
Access to full search results
➕
Access archive of magazine back copies
➕
Access to Projects in Progress
➕
Access to ONE Research Report of your choice in PDF format
RESEARCH CHANNEL AFRICA
R4500 (equivalent of R375 a month)
SUBSCRIBEAll benefits from Option 1
➕
Access to Creamer Media's Research Channel Africa for ALL Research Reports on various industrial and mining sectors, in PDF format, including on:
Electricity
➕
Water
➕
Energy Transition
➕
Hydrogen
➕
Roads, Rail and Ports
➕
Coal
➕
Gold
➕
Platinum
➕
Battery Metals
➕
etc.
Receive all benefits from Option 1 or Option 2 delivered to numerous people at your company
➕
Multiple User names and Passwords for simultaneous log-ins
➕
Intranet integration access to all in your organisation